The next generation of ocean exploration
The Ocean. In a sandbox
What happens when scientists and designers join forces to solve how to visualize Ocean Eddies?
Nothing much, we dent the universe the ocean floor
SPONSORED COLLEGE PROJECT
CONTEXT
Context
Studio class at ArtCenter College of Design, 14 weeks. Partner/Sponsor: MIT Wood Hole Oceanography Institute
Under Grant from: Keck NAKFI
Studio class at ArtCenter College of Design, 14 weeks. Partner/Sponsor: MIT Wood Hole Oceanography Institute. Under Grant from: Keck NAKFI
TEAM SIZE
Team Size
Proof of concept: 3
Further Development: Self
Proof of concept: 3
Further Development: Self
ROLE
Role
Research, Conceptualization, Prototyping, Wireframing and Visual Interface Design
Research, Conceptualization, Prototyping, Wireframing and Visual Interface Design
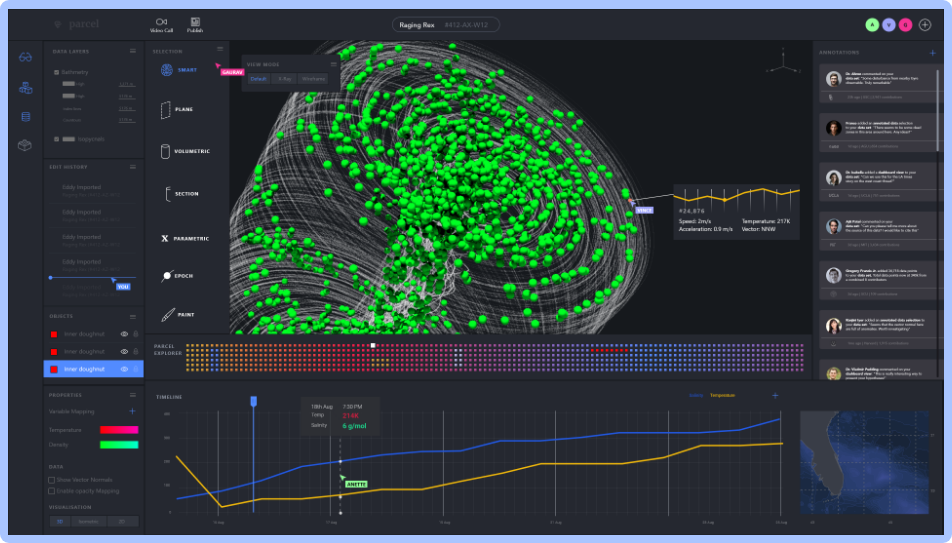
in 7 seconds Parcel ...
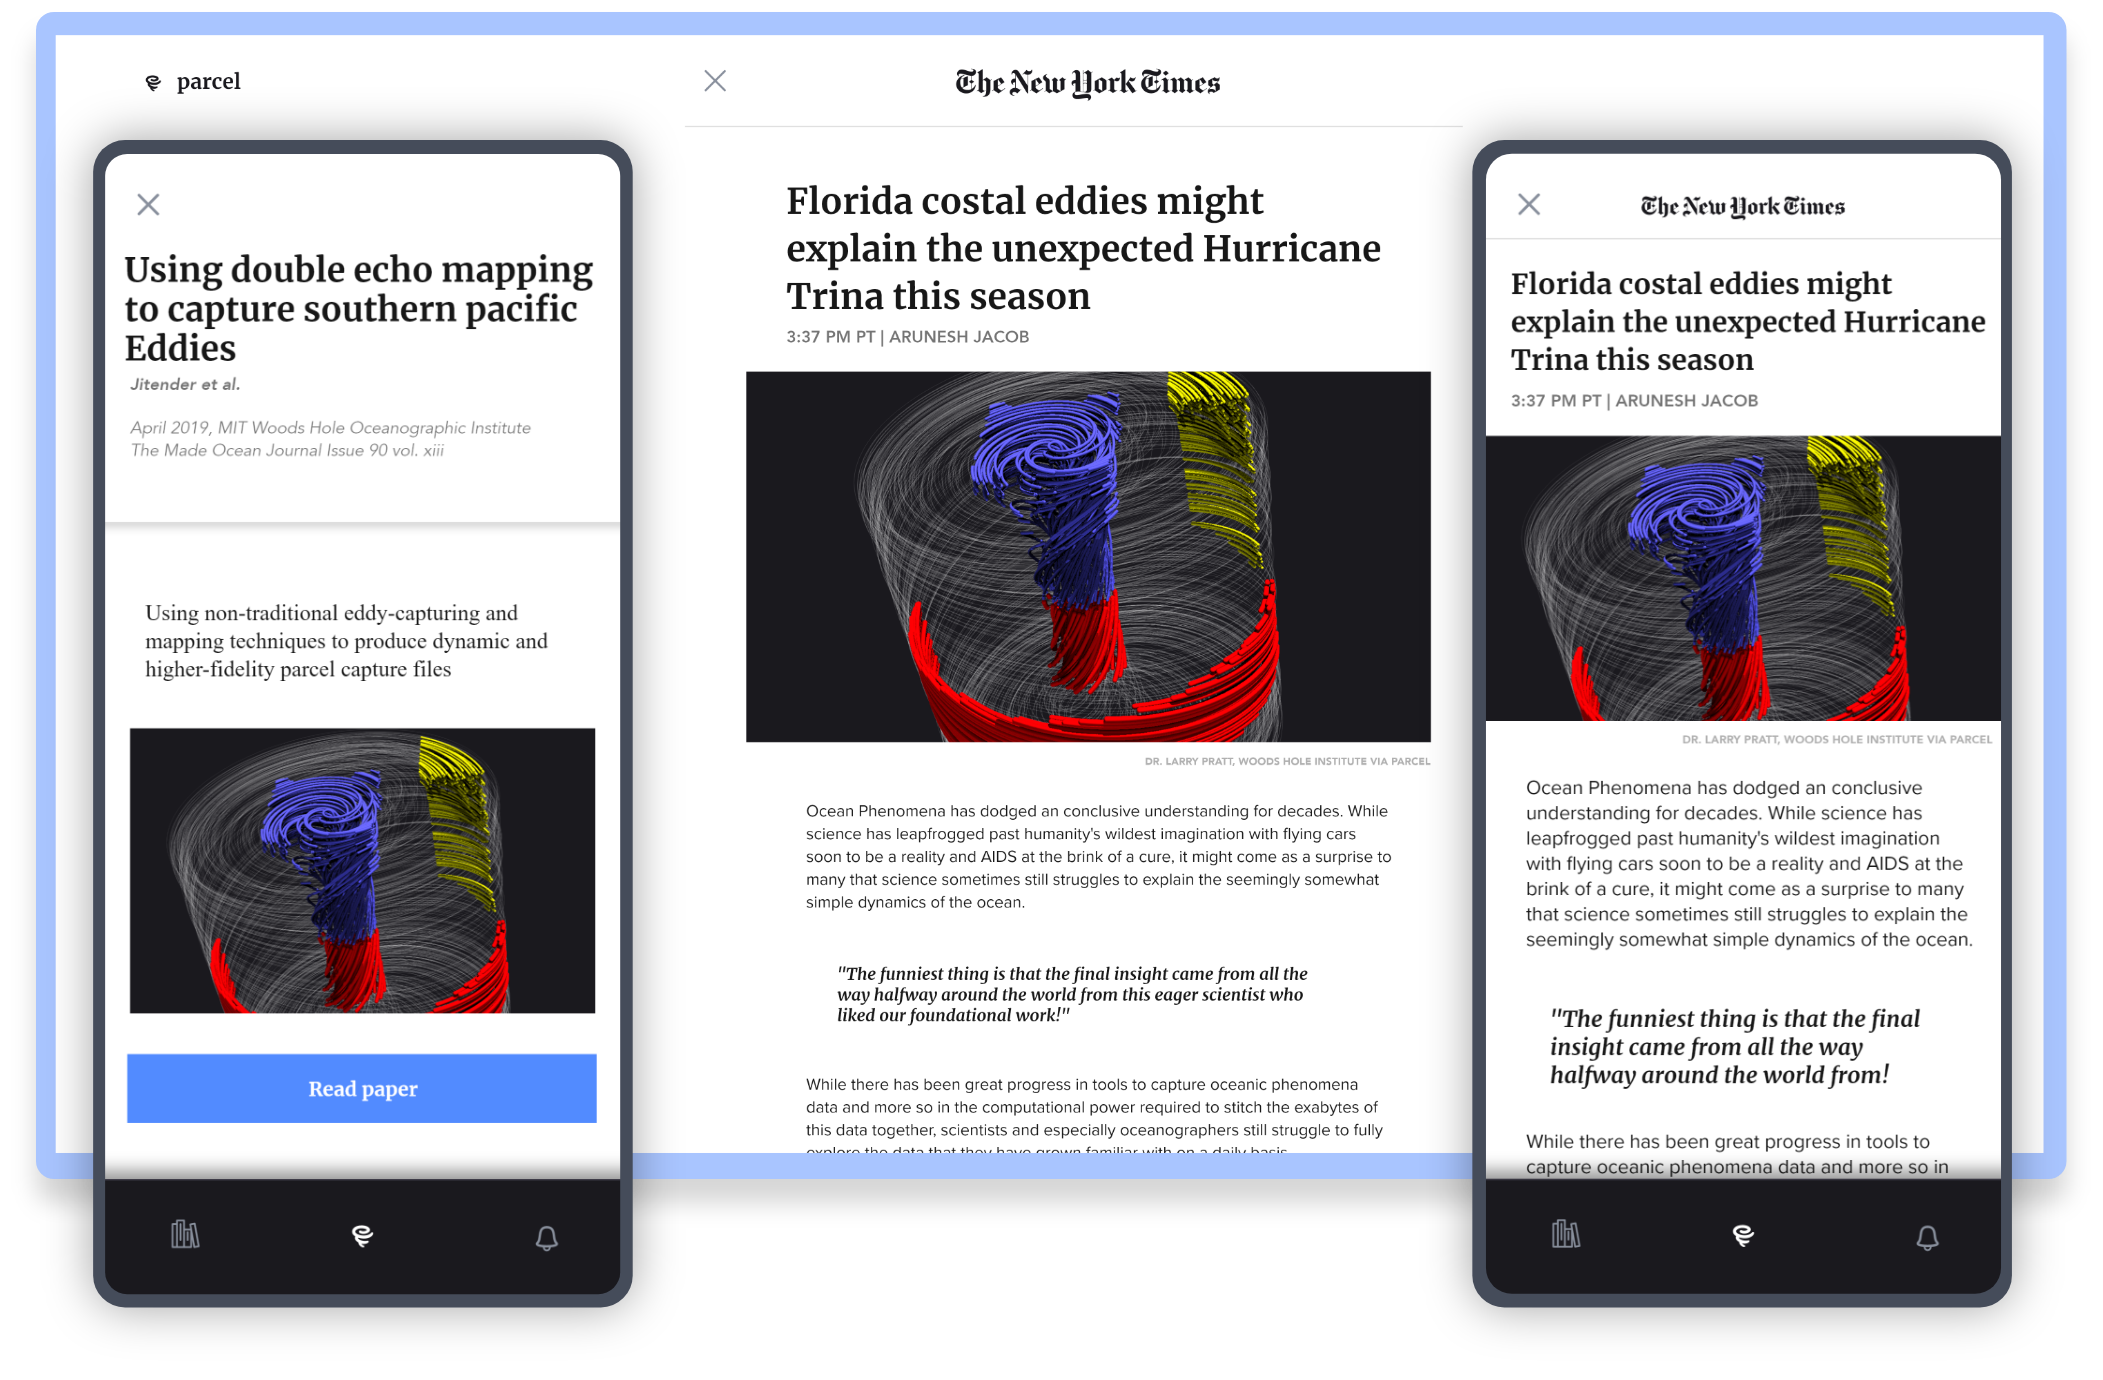
... supercharges oceanographers' lives to fully explore and play with their previously under-explored rich ocean eddy data to make meaningful discoveries
Conceptualized a product that allows oceanographers to fully explore and play with their previously under-explored rich ocean eddy data to make meaningful discoveries
a deeper "dive"
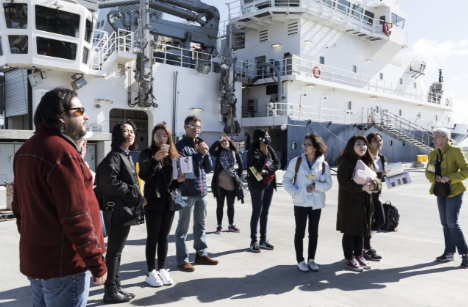
Field research
Field research
Observed life and instrumentation on deck a research vessel. Interacted with, interviewed and observed 4 PhD scientists at Scripps Oceanography Institute, San Diego
Observed life and instrumentation on deck a research vessel. Interacted with, interviewed and observed 4 PhD scientists at Scripps Oceanography Institute, San Diego
👓
👓
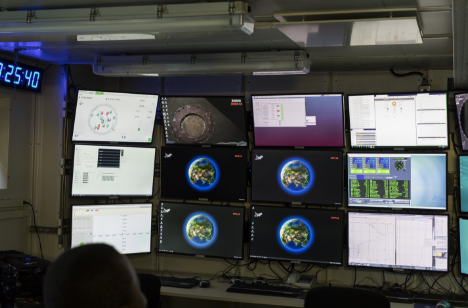
What is stopping scientists from making the discoveries they set out to make?
What is stopping scientists from making the discoveries they set out to make?
Scientists have to use tools like the one on the left to understand complex phenomena like on the right
Scientists have to use tools like the one on the left to understand complex phenomena like on the right
👓
👓
Oceanographers have three distinct needs, in order of importance
Oceanographers have three distinct needs, in order of importance
Explore and analyse data
Publish findings
Stay connected to community
INSIGHT #1
INSIGHT #1
Oceanographers really want to but can't analyse or explore sub-sections of their data
Oceanographers really want to but can't analyse or explore sub-sections of their data
🔎
🔎
Current tools only allow oceanographers to look at ocean eddies as an entire data point
Current tools only allow oceanographers to look at ocean eddies as an entire data point
🎯
🎯
Create tools and systems to enable intuitive and exploratory sub-selection and analysis of the data
Create tools and systems to enable intuitive and exploratory sub-selection and analysis of the data
💡
💡
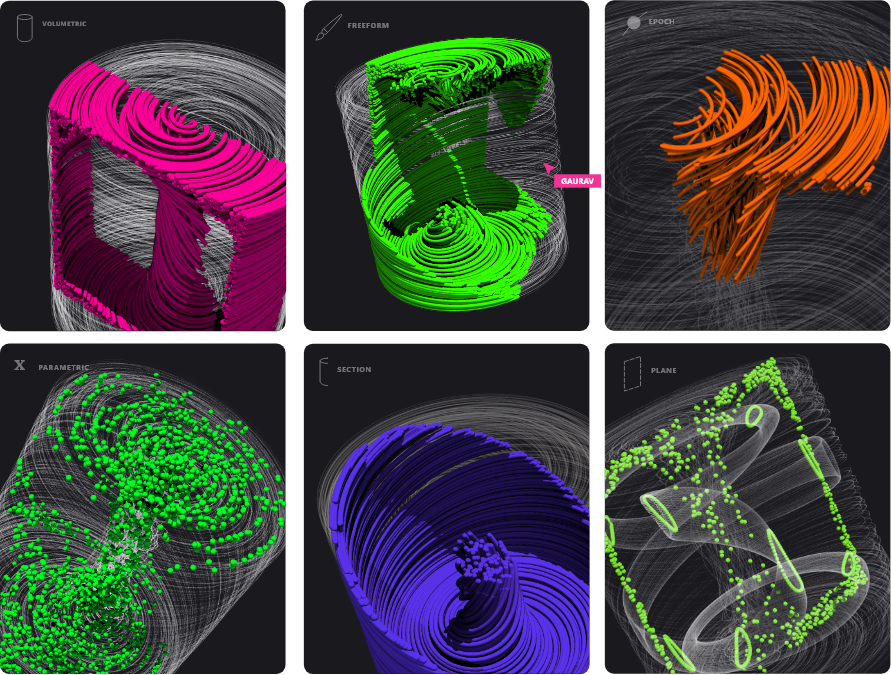
3D sub-selection tools
3D sub-selection tools
Ghosted data trajectories allow oceanographers to the sub-selection in context of the entire eddy/current. Ray tracing rendering brings the visuals to life.
Ghosted data trajectories allow oceanographers to the sub-selection in context of the entire eddy/current. Ray tracing rendering brings the visuals to life.
💡
💡
2D selection of 3D data
2D selection of 3D data
The patterns which emerge when looking at data through abstracted visualisations can be groundbreaking - we wante dto enable oceanographers to be able to "flatten" out their 3D data to get a 10,000 foot overview
The patterns which emerge when looking at data through abstracted visualisations can be groundbreaking - we wante dto enable oceanographers to be able to "flatten" out their 3D data to get a 10,000 foot overview

INSIGHT #2
Oceanographers are exploring their data in isolation from each other across institutes, and countries. And they dislike that
Oceanographers are exploring their data in isolation from each other across institutes, and countries. And they dislike that
🔎
🔎
Not all oceanographers live in proximity to the ocean and collaboration is a common practice - but right now there's a lot of hoops to jump through
Not all oceanographers live in proximity to the ocean and collaboration is a common practice - but right now there's a lot of hoops to jump through
🎯
🎯
Create tools which allow oceanographers to collaborate without any friction
Create tools which allow oceanographers to collaborate without any friction
Create tools which allow oceanographers to collaborate without any friction
👓
👓
Fluent use of other collaboration tools like Google Docs
Fluent use of other collaboration tools like Google Docs
Fluent use of other collaboration tools like Google Docs
💡
💡
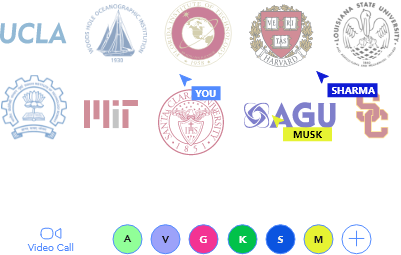
Mimic the collaborative nature of the products they're already familiar with to enable the brightest minds to "solve climate change in real time while shattering boundaries".
Institutions indicative of possible collaborators. No affiliation indicated
Mimic the collaborative nature of the products they're already familiar with to enable the brightest minds to "solve climate change in real time while shattering boundaries".
Institutions indicative of possible collaborators. No affiliation indicated
👓
👓
Desire for and presence of cross-disciplinary, multi-institution Collaboration
Desire for and presence of cross-disciplinary, multi-institution Collaboration
💡
💡
We wanted to make collaborating with engineers as frictionless as to collaborate with a fellow oceanographer with video chat being in-built.
We wanted to make collaborating with engineers as frictionless as to collaborate with a fellow oceanographer with video chat being in-built.
💡
💡
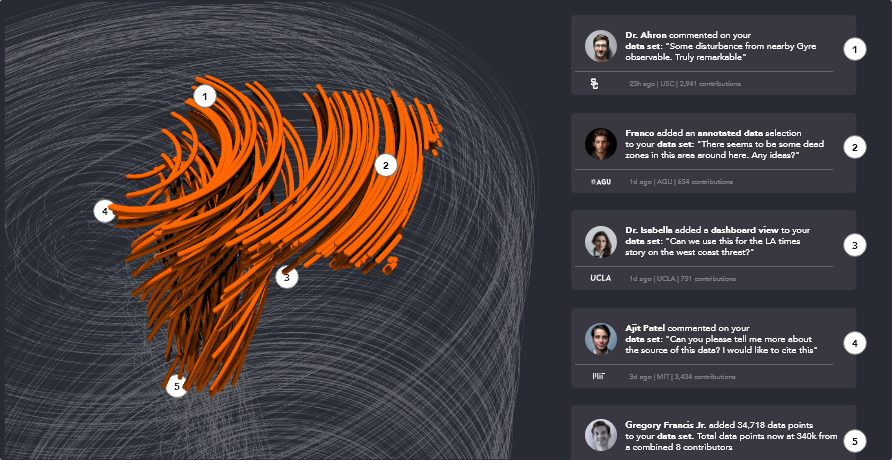
Contextual Collaborative Annotations
Contextual Collaborative Annotations
Leave behind your questions, observations and comments in the data itself for others to explore and turn into discoveries!
👓
👓
Complex and scattered data on various institutional and personal Gits/Subversions
Complex and scattered data on various institutional and personal Gits/Subversions
💡
💡
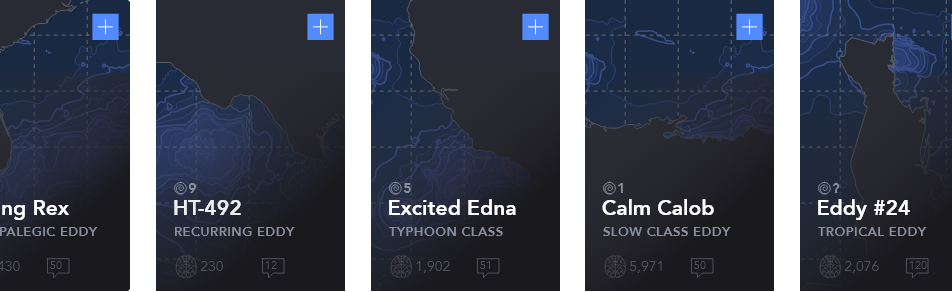
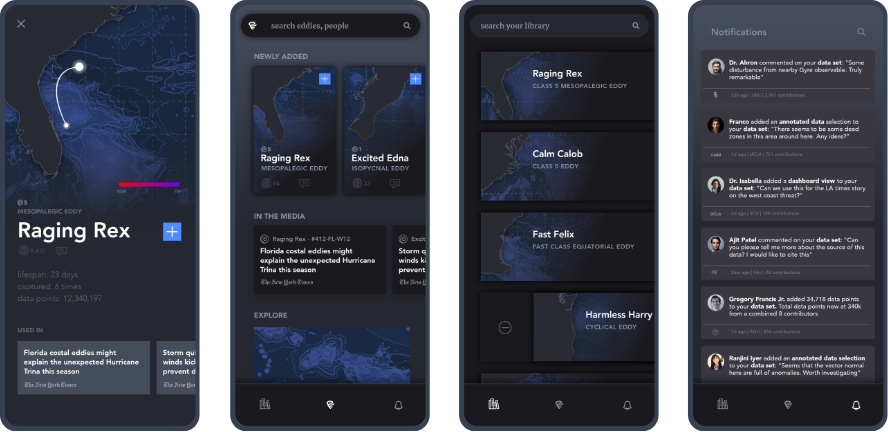
Centralised and aggregated library of Eddy data for oceanographers to explore and contribute to
Centralised and aggregated library of Eddy data for oceanographers to explore and contribute to
INSIGHT #3
Eddies evolve over time - days, months even years. Scientists don't have the tools to track these evolutions
Eddies evolve over time - days, months even years. Scientists don't have the tools to track these evolutions
💡
💡
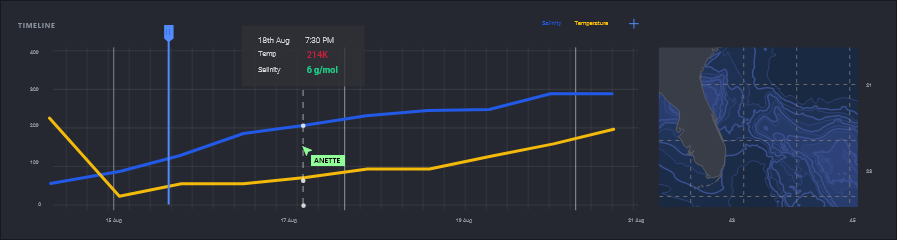
A time-based exploration paradigm
Oceanographers need tools to view an eddy at different points and to be able to replay the evolution of an eddy over time. Think of it like Premiere Pro for ocean eddies!
Future roadmap: Keyframe based Eddy generation and simulation!
Oceanographers need tools to view an eddy at different points and to be able to replay the evolution of an eddy over time. Think of it like Premiere Pro for ocean eddies!
Future roadmap: Keyframe based Eddy generation and simulation!
Oceanographers need tools to view an eddy at different points and to be able to replay the evolution of an eddy over time. Think of it like Premiere Pro for ocean eddies!
Future roadmap: Keyframe based Eddy generation and simulation!
INSIGHT #4
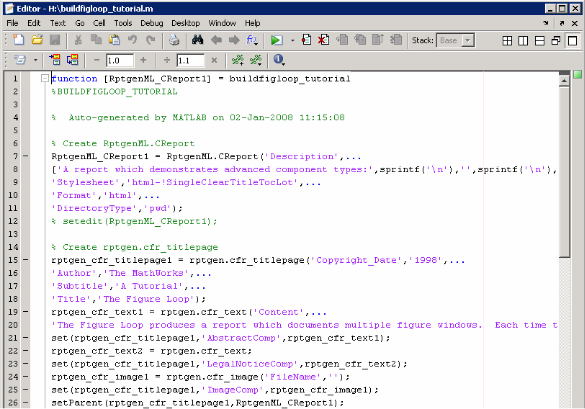
There is a glaring disconnect between data manipulation and feedback
There is a glaring disconnect between data manipulation and feedback
🔎
🔎
Oceanographers need to code, compile and render to see their changes take place
Oceanographers need to code, compile and render to see their changes take place
🎯
🎯
Create real time WYSIWYG tools and platforms for them to manipulate, modify and control their data and their visualizations
Create real time WYSIWYG tools and platforms for them to manipulate, modify and control their data and their visualizations
💡
💡
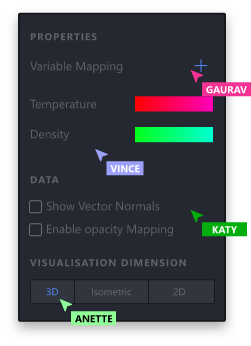
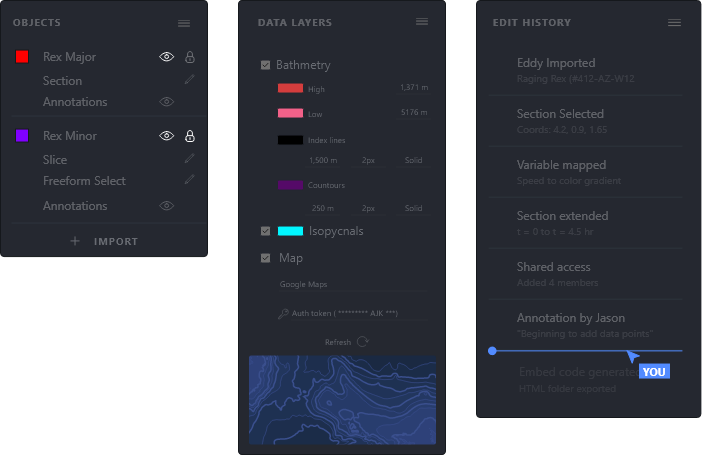
Data manipulation toolbars
Data manipulation toolbars
Giving oceanographers the tools to modify their data in-situ, control data layers, objects, viewing actions, connecting external data, managing APIs and token.
Edit history enables non-destructive rollbacks in different points of actions, and manipulations - similar to other step-based build softwares like SolidWorks
💡
💡
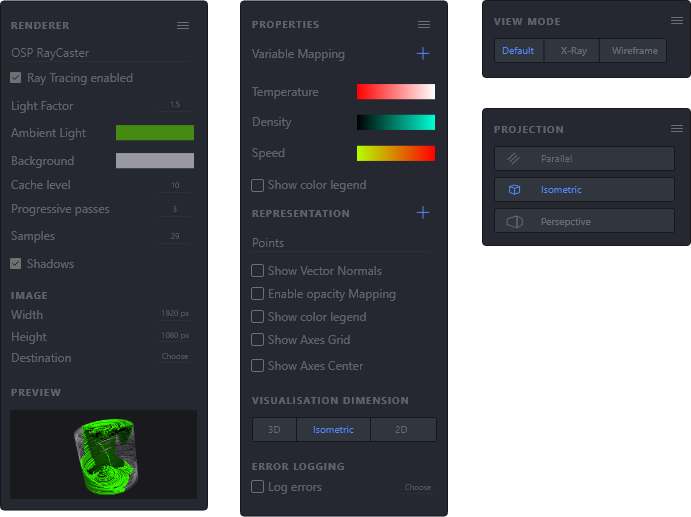
View and Render control toolbars
View and Render control toolbars
Visual affordances enable oceanographers to quickly visualise the almost-infinite ways to visualize the data instead of having to rely on code
Visual affordances enable oceanographers to quickly visualise the almost-infinite ways to visualize the data instead of having to rely on code
INSIGHT #5
Sharing scientific data is jargon-loaded and often too technical for it to be enjoyable to consumed by the masses
Sharing scientific data is jargon-loaded and often too technical for it to be enjoyable to consumed by the masses
💡
💡
Hosted universal data viz ibrary
We wanted to enable these dynamic and interactive visualizations to be distributed anywhere. This can be realised with a WebGL library to make the discoveries be compelling, interactive and embeddable in Journal publications, Prime time TV, print media - everywhere
INSIGHT #6
INSIGHT #6
Scientists can't have a conversation about their work unless they are at their physical terminal
💡
💡
Mobile companion
Imagine being at a conference and being able to whip out your recent discovery. Imagine sparking an idea in someone else in that meeting! Oceanographers can finally talk about their work without having to rely on their terminal with them!
Outcome & Credits
Outcome & Credits
Project was featured as part of partnership case study progress update to other grant awardees at the NAKFI Mid-Cycle Grant meeting at Hyatt, Huntington Garden
Grant for proposal granted by the KECK NAKFI Futures Deep Blue Sea program at the National Acadmies of Science
Project was featured as part of partnership case study progress update to other grant awardees at the NAKFI Mid-Cycle Grant meeting at Hyatt, Huntington Garden
Grant for proposal granted by the KECK NAKFI Futures Deep Blue Sea program at the National Acadmies of Science
Project was featured in a case study presentation at the IXDA Education Summit by Maggie Hendrie, our department Chair
Project was featured in a case study presentation at the IXDA Education Summit by Maggie Hendrie, our department Chair

Foundational principles from Parcel were used in and to influence the development of a fluid trajectory design and simulation system at Caltech.

Grant proposal originally co-authored by Maggie Hendrie (ArtCenter) and Dr Larry Pratt (MIT Woods Hole Oceanogrpahy Institute)
Grant proposal originally co-authored by Maggie Hendrie (ArtCenter) and Dr Larry Pratt (MIT Woods Hole Oceanogrpahy Institute)

Social Impact Studio class coordinated by and taught at ArtCenter College of Design through Designmatters - the Social Innovation MInor
Social Impact Studio class coordinated by and taught at ArtCenter College of Design through Designmatters - the Social Innovation MInor
Projects and their outcomes were also presented at Cumulus Conference, University of Lapland, Rovaniemi, Finland
Projects and their outcomes were also presented at Cumulus Conference, University of Lapland, Rovaniemi, Finland
akshay agrawal
© Akshay Agrawal